Aim
To estimate the activities of Alanine Aminotransferase (ALT/SGPT) and Aspartate Aminotransferase (AST/SGOT) in serum using Reitman and Frankel's colorimetric method and interpret the results for the assessment of liver function.
Learning Objectives
After completing this experiment, students will be able to:
- Understand the physiological role of ALT and AST enzymes.
- Explain the principle of Reitman and Frankel's method.
- Prepare the reagents required for the assay.
- Perform the estimation of ALT and AST activities in serum.
- Calculate enzyme activity using a standard curve.
- Interpret the clinical significance of altered ALT and AST levels.
- Correlate enzyme levels with different liver diseases.
Problem Statement
Liver diseases often remain asymptomatic during their early stages. Laboratory estimation of liver enzymes provides an effective means of detecting hepatocellular injury before the appearance of clinical symptoms. Accurate determination of serum ALT and AST activities is therefore essential for diagnosing liver disorders, monitoring disease progression, and evaluating treatment response.
Introduction
The liver is the largest internal organ and performs numerous vital metabolic, synthetic, detoxification, and excretory functions. It plays a central role in carbohydrate, protein, and lipid metabolism, synthesis of plasma proteins and clotting factors, detoxification of drugs and toxins, storage of glycogen and vitamins, and production of bile.
Because of these diverse physiological functions, liver diseases can significantly affect overall metabolism. Assessment of liver function is therefore an important component of clinical diagnosis. A group of biochemical investigations collectively known as Liver Function Tests (LFTs) is routinely used to evaluate liver health.
Liver Function Tests generally include the estimation of:
- Alanine Aminotransferase (ALT/SGPT)
- Aspartate Aminotransferase (AST/SGOT)
- Alkaline Phosphatase (ALP)
- Gamma-Glutamyl Transferase (GGT)
- Bilirubin (Total and Direct)
- Serum Proteins (Albumin and Globulin)
- Prothrombin Time (PT)
Among these parameters, ALT and AST are considered sensitive biochemical markers of hepatocellular injury. They are intracellular enzymes that participate in amino acid metabolism. Under normal physiological conditions, only small amounts of these enzymes are present in the bloodstream. However, when hepatocytes are damaged due to viral hepatitis, drug toxicity, alcoholic liver disease, or other hepatic disorders, these enzymes leak into the circulation, resulting in elevated serum levels.
Measurement of ALT and AST is therefore one of the most widely performed laboratory investigations for evaluating liver injury.
Theory
Transaminases
Transaminases, also called aminotransferases, are enzymes that catalyse the reversible transfer of an amino group from an amino acid to an α-keto acid. These reactions are essential for amino acid metabolism and the synthesis of non-essential amino acids.
All aminotransferases require Pyridoxal-5'-Phosphate (PLP), the active form of vitamin B₆, as a coenzyme.
The two clinically important transaminases are:
- Alanine Aminotransferase (ALT or SGPT)
- Aspartate Aminotransferase (AST or SGOT)
Alanine Aminotransferase (ALT/SGPT)
ALT is present predominantly in the cytoplasm of hepatocytes, making it a highly specific indicator of liver cell injury.
It catalyses the reversible transfer of the amino group from L-alanine to α-ketoglutarate, producing pyruvate and L-glutamate.
Reaction
L-Alanine + α-Ketoglutarate ⇌ Pyruvate + L-Glutamate
Because ALT is found mainly in liver tissue, elevated serum ALT levels are strongly associated with hepatocellular damage.
Aspartate Aminotransferase (AST/SGOT)
AST is present in both the cytoplasm and mitochondria of hepatocytes and is also abundant in cardiac muscle, skeletal muscle, kidneys, brain, and red blood cells.
It catalyses the transfer of the amino group from L-aspartate to α-ketoglutarate, producing oxaloacetate and L-glutamate.
Reaction
L-Aspartate + α-Ketoglutarate ⇌ Oxaloacetate + L-Glutamate
Since AST is present in several tissues, elevated AST levels are not specific for liver disease and may also occur in myocardial infarction, skeletal muscle injury, hemolysis, and other conditions.
Principle
The estimation of ALT and AST is based on the Reitman and Frankel colorimetric method.

- ALT and AST catalyse transamination reactions, producing pyruvate or oxaloacetate, respectively.
- These keto acids react with 2,4-dinitrophenylhydrazine (DNPH) to form brown-coloured hydrazone complexes.
- Upon addition of 0.4 N sodium hydroxide, the colour intensity increases.
- The absorbance is measured at 505
520 nm
using a colorimeter or spectrophotometer. - The colour intensity is directly proportional to the enzyme activity present in the serum sample.
Clinical Significance
Elevated ALT
- Acute viral hepatitis
- Drug-induced liver injury
- Non-alcoholic fatty liver disease (NAFLD)
- Hepatic ischemia
- Toxic liver injury
Elevated AST
- Acute hepatitis
- Alcoholic liver disease
- Cirrhosis
- Myocardial infarction
- Skeletal muscle disorders
- Hemolytic anemia
AST/ALT Ratio
|
AST/ALT Ratio |
Clinical Interpretation |
|
< 1 |
Acute viral hepatitis, NAFLD |
|
≈ 1 |
Chronic liver disease |
|
> 2 |
Alcoholic liver disease |
SGPT - ALT
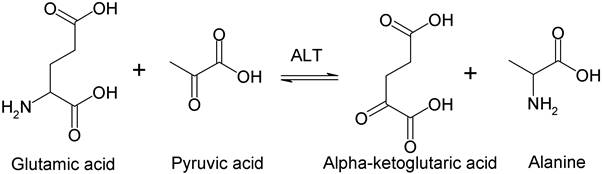
SGOT - AST

ALT is a cytoplasmic enzyme while AST is found in both cytoplasm and mitochondria.
The activity of these enzymes is low in normal serum.
Serum ALT and AST are increased in liver damage.
However, alanine trans-aminase is more sensitive and reliable for the assessment of LFT.
The normal AST/ALT ratio is around 0.8.
This ratio is increased (>2) in myocardial infarction, alcoholic hepatitis, and cirrhosis.
AST/ALT ratio is decreased (i.e. ALT higher) in acute hepatocellular damage and cholestasis.
REQUIREMENTS
Chemicals/Reagents:
-
M/15 Phosphate buffer, pH 7.4
-
SGOT substrate: 2.66 g aspartic acid, 30 mg α-ketoglutarate, 20.5 mL 1N NaOH; bring to 100 mL in buffer, pH 7.4
-
SGPT substrate: 1.78 g alanine, 30 mg α-ketoglutarate, 1.25 mL 0.4N NaOH; bring to 100 mL in buffer, pH 7.4
-
DNPH reagent: 200 mg DNPH, 85 mL conc. HCl, make up to 1000 mL distilled water
-
0.4N NaOH
-
Sodium pyruvate standard (22 mg/dL)
Apparatus/Glassware:
-
Water bath/incubator at 37°C
-
Colorimeter/spectrophotometer (530 nm)
-
Graduated test tubes and pipettes
-
Refrigerator (for substrate storage; add chloroform preservative if required)
-
Stopwatch or timer
PROTOCOL
A. Preparation of Standard Calibration Curve
-
Prepare tubes with varying volumes of SGOT or SGPT substrate and sodium pyruvate standard as follows:
| Tube | Substrate (ml) | Pyruvate Std. (ml) | dH₂O (ml) | DNPH (ml) | NaOH (ml) | Karmen Units |
|---|---|---|---|---|---|---|
| 1 | 0.45 | 0.05 | 0.10 | 0.5 | 5 | 27 |
| 2 | 0.40 | 0.10 | 0.10 | 0.5 | 5 | 61 |
| 3 | 0.35 | 0.15 | 0.10 | 0.5 | 5 | 114 |
| 4 | 0.30 | 0.20 | 0.10 | 0.5 | 5 | 190 |
| Blank | 0.50 | — | 0.10 | 0.5 | 5 | 0 |
-
Mix all solutions, incubate at room temperature for 20 minutes.
-
Add 5 mL of 0.4N NaOH, mix thoroughly, incubate for 10 minutes.
-
Measure the absorbance at 530 nm for each tube.
-
Plot calibration curve: Karmen units (X-axis) vs absorbance (Y-axis).
B. Assay of Serum Test Sample
-
Pipette 0.5 ml substrate (SGOT or SGPT, prewarmed at 37°C) into a test tube.
-
Add 0.1 ml serum sample.
-
Incubate at 37°C for:
-
SGOT: 60 minutes
-
SGPT: 30 minutes
-
-
Add 0.5 ml DNPH, mix, leave at room temperature for 20 minutes.
-
Add 5 ml 0.4N NaOH, mix, leave at room temperature for another 10 minutes.
-
Measure test tube absorbance at 530 nm.
For liver function tests : SGPT and SGOT :
1. Preparation of standard graph for GOT / GPT assay :
|
|
1 |
2 |
3 |
4 |
Blank |
Test |
|
GOT / GPT substrate (ml) |
0.45 |
0.4 |
0.35 |
0.3 |
0.5 |
0.5 |
|
Std. Sodium pyruvate (ml) |
0.05 |
0.1 |
0.15 |
0.2 |
- |
- |
|
Distilled water (ml) |
0.1 |
0.1 |
0.1 |
0.1 |
0.1 |
0.1 |
|
DNPH reagent (ml) |
0.5 |
0.5 |
0.5 |
0.5 |
0.5 |
0.5 |
|
Mix thoroughly, keep at room temperature for 20 minutes. |
|
|||||
|
0.4N NaOH. (ml) |
5 |
5 |
5 |
5 |
5 |
5 |
|
Karmen units (GOT) |
27 |
61 |
114 |
190 |
0 |
X |
|
Karmen units (GPT) |
28 |
57 |
97 |
150 |
0 |
Y |
|
Mix and keep at room temperature for 10 minutes. Read absorbance at 530 nm. |
|
|||||
|
A 530 GOT |
|
|
|
|
|
|
|
A 530 GPT |
|
|
|
|
|
|
Draw a curve of Karmen units on X axis versus absorbance on Y axis
2. Treatment of test sample :
• To 0.5 ml of GOT / GPT substrate prewarmed to 37°C, add 0.1 ml of serum and incubate at 37°C for 60 minutes for GOT / 30 minutes for GPT.
• Add 0.5 ml of DNPH. Mix thoroughly, keep at room temperature for 20 minutes.
• Add 5 ml of 0.4N NaOH. Mix and keep at room temperature for 10 minutes.
• Read absorbance at 530 nm.
Normal value :
The adult reference range for both AST and ALT is roughly 10-40 U/L i.e. 20.83 - 83.33 Karmen Units when measured at 37°C.
Although men have slightly higher values than women do, most laboratories use a single range for both genders.
Note :
• Karmen unit/ ml is equivalent to 0.48 U/L.
• The GOT / GPT substrate can be preserved in refrigerator by adding 1 ml of chloroform. Discard the substrate solution on appearance of turbidity.
CALCULATION & GRAPH
Karmen unit:
A Karmen unit is defined as the amount of enzyme required to produce enough pyruvic acid in 1 mL of serum in a reaction volume of 3 mL, at 25°C, that causes a decrease in NADH absorbance by 0.001 per minute in a spectrophotometric assay.
In the colorimetric DNPH method used by Reitman & Frankel, this relates to the amount of pyruvate formed that reacts to give a measurable color.
Purpose:
Karmen units quantify the enzyme activity in the given sample, expressing how much substrate (e.g., pyruvate) is produced per unit time by the transaminase enzyme.
The graph used in the Reitman & Frankel colorimetric test is a calibration curve that helps turn color readings from the experiment into actual enzyme activity values.
What does the graph look like?
-
On the X-axis (horizontal) are numbers called Karmen units, which are values that match known amounts of the product (pyruvate or oxaloacetate).
-
On the Y-axis (vertical) are the absorbance values, measured with a colorimeter at 530 nm, telling you how dark the color in each tube is after the reaction.
Why do we make this graph?
When you do the experiment, you'll get a color in each tube (from the hydrazone reaction), and you'll measure how strong that color is using the colorimeter. But you need to know what that color strength means in terms of actual enzyme activity. The calibration graph shows what absorbance (color intensity) is expected for each known Karmen unit.
How is the graph made?
-
Prepare standard tubes. Each has a different, known concentration of sodium pyruvate (or oxaloacetate).
-
Run the full color reaction. Add reagents and let color develop in a set time, just like you would for your test sample.
-
Measure absorbance. Use the colorimeter for all standards and write down the numbers.
-
Plot the points. Put each absorbance value on the graph and match it with the Karmen unit for that tube.
-
Draw the curve. Connect the dots—you'll see how the absorbance changes as the Karmen units go up.
How do you use the graph?
-
Measure the absorbance of your test serum sample.
-
Find that absorbance on the Y-axis of your calibration curve.
-
Move horizontally to see where you hit the curve, then drop down to the X-axis.
-
Read the corresponding Karmen unit. This gives you the enzyme activity for your test sample.
Why do it this way?
-
Sometimes the color response doesn't increase in a straight line (not perfectly linear), so using a graph makes sure you always get the right value for your sample.
-
It corrects for small differences between reagents, equipment, or setup each time you run the test.
Method
-
Use the observed absorbance of test serum to locate corresponding Karmen units from the calibration curve.
-
For example, if Abs530 (SGOT) = 0.11, the graph shows 38 Karmen units; Abs530 (SGPT) = 0.15, the graph shows 105 Karmen units.
-
Normal reference (adults): 20.83–83.33 Karmen units (10–40 U/L)
-
Men may have slightly higher values.
-
Karmen unit/ml ≈ 0.48 U/L
-
RESULTS
-
Plot the calibration curve and mark where your test absorbance falls.
-
Report Karmen units for SGPT and SGOT.
-
Compare with reference range.
CONCLUSION
Elevated values of SGPT (ALT) and SGOT (AST) enzymes reflect liver cell injury. Interpretation based on relative levels and the AST/ALT ratio distinguishes hepatitis, alcoholic liver disease, myocardial infarction, or cholestasis. The colorimetric Reitman & Frankel method offers a rapid, reliable strategy for routine LFTs in clinical labs. Results must be correlated with clinical history and other LFTs for accurate diagnosis.
Precautions:
-
Use fresh serum, avoid hemolysis and contamination.
-
Prepare reagents and calibration standards accurately and freshly.
-
Preserve substrate with a small quantity of chloroform if not used at once; discard on turbidity.
-
Incubate samples precisely for optimum reaction.
-
Interpret enzyme elevations within clinical context.
Summary Table of Interpretation
| SGPT/SGOT Result | Likely Interpretation |
|---|---|
| Normal (<40 U/L) | Healthy liver function |
| Mild increase (40–100 U/L) | Early cell injury, fatty liver |
| Moderate increase | Viral/acute hepatitis, drug toxicity |
| AST > ALT, ratio >2 | Alcoholic hepatitis, cirrhosis, extrahepatic damage |
| ALT > AST, ratio <1 | Acute viral hepatitis, severe hepatocellular damage |
| >1000 U/L | Massive necrosis, severe acute liver injury |
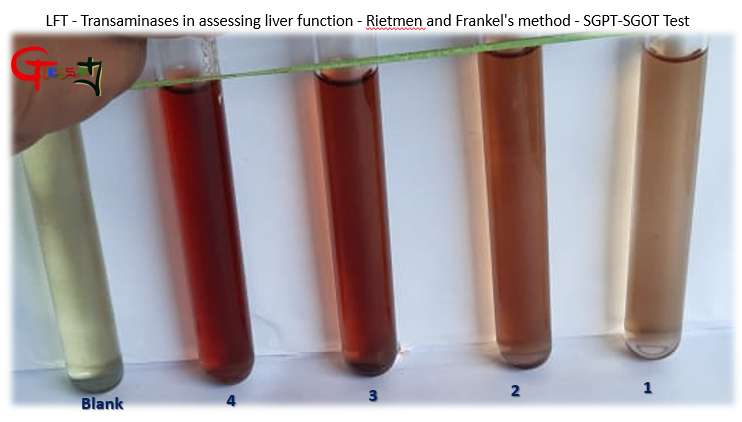
Draw a curve of Karmen units on X axis versus absorbance on Y axis
|
A 530 GOT |
0.11 |
|
A 530 GPT |
0.15 |
